Uracil BI
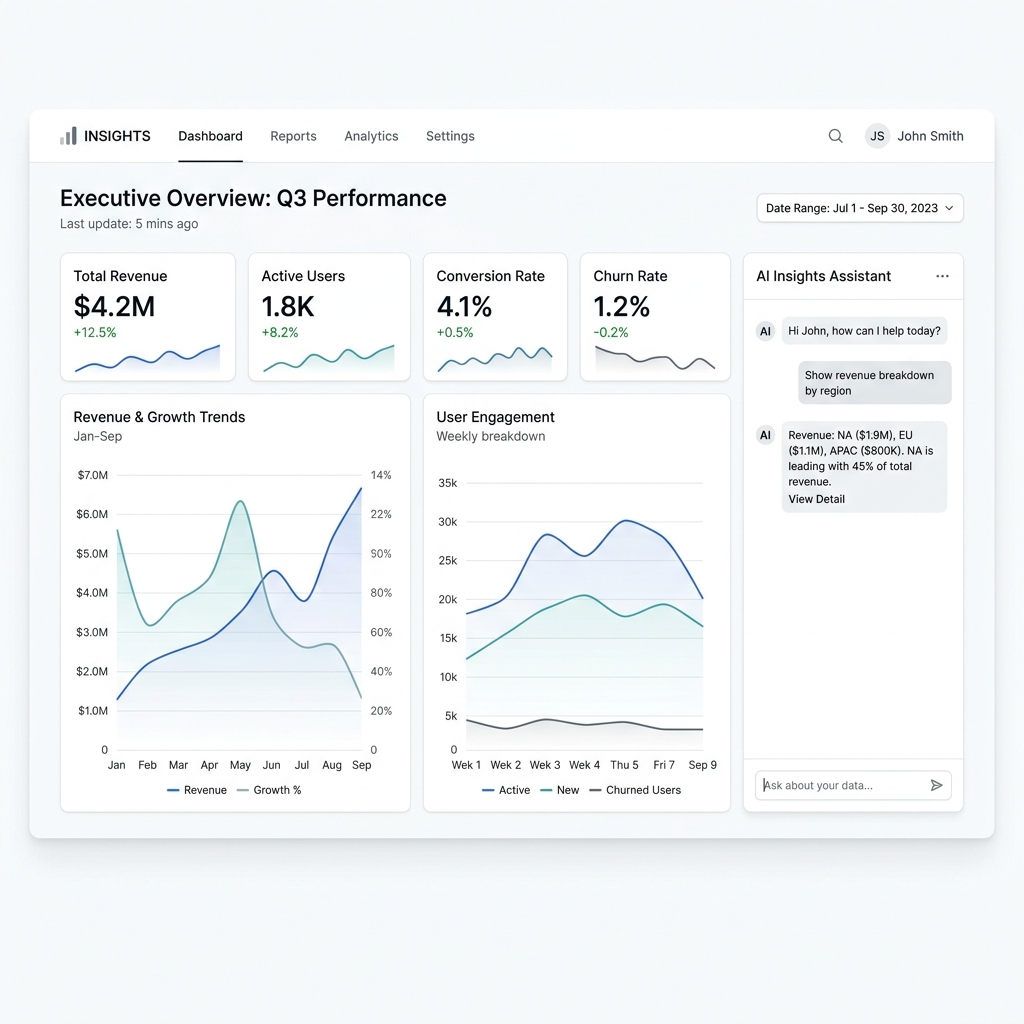
Uracil BI turns complicated data into simple, clear visual dashboards. It automatically builds interactive reports that show key results and long-term trends using engaging charts and straightforward metrics. Simply upload your information through excel files, and let it turn complex numbers into easy-to-understand insights, helping your team make smarter decisions quickly.
What Problem We Are Solving
Traditional BI tools require SQL knowledge and dedicated data analysts. Executives wait days for reports and dashboards that represent static past data rather than predictive insights.
Use Cases
- Natural language to SQL/Graph dashboard generation.
- Automated KPI tracking and anomaly detection.
- Predictive modeling on raw CSV/Database inputs.